Supplier Performance Management: From Scorecards to Real-Time Coordination
Most supplier scorecards are accurate. The problem is that they are accurate about the past. By the time a supplier's on-time delivery rate has declined enough to register as a concern on a quarterly review, the disruption it signals has already begun accumulating in the production schedule. This article examines why retrospective supplier performance management is the wrong tool for a real-time problem, what early warning signals actually look like before a disruption becomes visible, and how connecting supplier performance signals to operational workflows creates the accountability structure that prevents the supply failures that scorecards can only document.

.png)
A supplier performance review meeting has a particular rhythm that most procurement and operations leaders recognize immediately. The scorecard is presented. On-time delivery is at 87 percent, down from 91 percent last quarter. Quality rejection rate is stable at 1.4 percent. Lead time variance has increased from 3.2 days to 4.7 days. The supplier's representative explains that capacity constraints in Q3 created the delivery pressure and that Q4 is expected to improve. The meeting closes. The corrective action plan goes into the tracker. And three months later, the same conversation happens again, with slightly different numbers.
What is missing from this review is not data. The scorecard is accurate. What is missing is the connection between the data and the operational consequences it documents - and the absence of any mechanism that would have caught the supplier's Q3 capacity constraint before it produced the delivery performance decline that showed up on the scorecard.
This is the core problem in supplier performance management as most manufacturing operations practise it. The scorecards measure accurately. The quarterly reviews surface the right information. The corrective action process is structured. And yet the supply disruptions that erode production schedules, generate expediting costs, and create customer delivery problems continue to occur - because the management system was designed to document past performance rather than to prevent future failures.
This article examines why retrospective scorecards are structurally inadequate for supply chain coordination, what the early warning signals of supplier stress actually look like, and what operational coordination looks like when it is connected to the workflows that can actually act on those signals before a disruption becomes a production emergency.
Why Quarterly Reviews Are Retrospective by Design
The quarterly supplier performance review is the natural product of how performance data is collected in most manufacturing operations. Delivery data comes from the ERP or warehouse management system. Quality data comes from incoming inspection records and rejection logs. Lead time data comes from purchase order histories. All of these data sources are accurate, but they are all records of transactions that have already been completed. The quarterly review aggregates these records into trend analysis and presents them to the supplier after the period has closed.
By the time the OTD rate has declined to 87 percent, every delivery that contributed to the decline has already been late. The production disruption it caused has already been absorbed - through overtime, schedule rearrangement, customer delivery delays, or expediting cost. The review identifies the pattern accurately but provides no mechanism to intervene before the pattern produces its consequences. In a supply chain that moves at operational speed, a quarterly review cycle is a fundamentally retrospective instrument.
The structural limitation of retrospective review is well established in supply chain operations research. APQC's benchmarking on procurement and supplier management consistently shows a material performance gap between organizations that have invested in continuous supplier monitoring - integrating supplier performance data directly into procurement workflows - and those that rely on periodic review. The gap is not explained by supplier quality or category mix; it is explained by the monitoring and response model. Organizations that see supplier performance signals in near-real time can respond to emerging problems before they produce scorecard-visible failures. Organizations that see those same signals quarterly respond after the production impact has been absorbed.
What Supplier Stress Looks Like Before the Disruption
Supply disruptions at the manufacturer are rarely sudden from the supplier's perspective. A supplier that delivers late for three weeks running did not develop a delivery problem in week three; the conditions that produced the late delivery were present earlier, in forms that the buyer's quarterly scorecard did not capture.
Understanding these pre-disruption signals is the most important diagnostic capability in operational supplier performance management. They fall into three categories.
Communication Pattern Changes
A supplier that is operating normally acknowledges purchase orders promptly, confirms delivery dates when requested, and initiates communication proactively when conditions change. A supplier under capacity or quality stress changes these patterns - not dramatically, but consistently. PO acknowledgements take longer. Delivery date confirmations become less precise. Proactive outreach about potential delays declines. The supplier responds to buyer inquiries rather than anticipating them.
These communication pattern changes are not visible in a quarterly OTD review because they do not directly affect the delivery outcome data - at least not yet. They are visible in the daily operational data: the average time between PO issuance and acknowledgement, the frequency and timing of delivery confirmation responses, the ratio of proactive supplier communications to reactive ones. A buyer whose procurement workflow tracks these signals has an early warning of supplier stress that arrives weeks before the delivery performance data reflects it.
Lead Time Behavior at the Individual Order Level
Quarterly lead time variance metrics aggregate individual order lead times into a single average that conceals the pattern within the distribution. A supplier whose average lead time has increased by 1.5 days may have improved on standard orders while slipping significantly on a specific product category, a specific plant, or orders placed in specific week patterns that reflect an underlying production scheduling problem. The aggregate metric is accurate; the pattern beneath it is the signal.
Monitoring lead time behavior at the order level rather than the aggregate level surfaces these patterns in time to address them. A consistent lead time slip on a specific part number across the past four orders is actionable before it produces a production stoppage. The same slip detected in a quarterly average after twelve orders have been affected is historical data about a disruption that has already occurred.
Quality Excursion Frequency Before Formal Rejection
Quality problems at the supplier level often produce a sequence: first, borderline lots that pass incoming inspection but generate field performance concerns; then, lots that require operator-level disposition decisions before acceptance; then, formal rejections. The quarterly rejection rate captures the formal rejections. The preceding sequence - the borderline lots, the disposition decisions, the informal quality flags that operations teams raise before they escalate to a formal record - is the early warning that most scorecard systems do not collect.
Operations teams that track informal quality flags alongside formal rejections see the supplier quality trajectory two to six weeks earlier than teams relying solely on rejection rate metrics. The informal flag data requires a workflow investment - a structured way for receiving and production teams to capture and communicate supplier quality concerns before they reach the formal rejection threshold - but that investment consistently produces earlier problem identification and lower total disruption cost.
The Gap Between Scorecards and Operational Accountability
Even when the scorecard data is accurate and the performance review is well-structured, four specific gaps prevent the supplier performance management system from producing the operational accountability that prevents disruptions.
The first gap is between the review and the production plan. Quarterly supplier reviews happen in procurement. The production plan lives in operations. The two functions review the same underlying data on different timelines, in different meetings, against different objectives. When a supplier's delivery performance decline shows up in a procurement scorecard, the operations team may already have absorbed the impact in the current schedule - but the next quarter's supply risk that the scorecard predicts has not yet been factored into the production plan. The scorecard is an input to operations planning that arrives after the planning cycle has already closed.
The second gap is between the scorecard metric and the corrective action. Most corrective action processes in supplier management are structured around getting the supplier to commit to improvement plans. The supplier submits a root cause analysis. A corrective action deadline is set. The next quarterly review assesses whether the metric has improved. This loop takes three to four months and produces changes in supplier behaviour only when the supplier is motivated to make them. It does not produce a change in the buyer's operational response to the supplier's current performance status.
The third gap is between the scorecard and the sourcing decision. A supplier whose performance is declining has moved the buyer's risk exposure in ways that the quarterly review documents but does not automatically translate into sourcing actions. The White House 100-day supply chain review report documented that the single most consistent driver of U.S. manufacturing supply chain vulnerability across sectors is concentration risk - over-reliance on a small number of suppliers, or a single geographic source, without active monitoring of the signals that indicate when that reliance is becoming unsustainable. This concentration risk is not visible in a quarterly delivery performance metric unless the buyer maintains a continuous view of supplier capacity utilization, financial stability, and operational stress indicators alongside the delivery data.
The fourth gap is between the scorecard and the workflow trigger. When a supplier signal indicates emerging stress - a communication pattern shift, a lead time slip on a specific part number, an informal quality flag sequence - the action that signal requires is not a quarterly review meeting. It is an immediate workflow trigger: a buyer's inquiry, a capacity reservation, an alternate supplier qualification, a production schedule adjustment. These are operational actions that procurement, planning, and production need to execute in real time, and they require a signal delivery mechanism that operates on a daily or weekly cadence rather than a quarterly one.
Together, these four gaps define the structural difference between supplier performance measurement - which most operations do well - and supplier management, which most operations do retrospectively.
The following shows the distinction between the two models across the dimensions that matter most to production continuity:
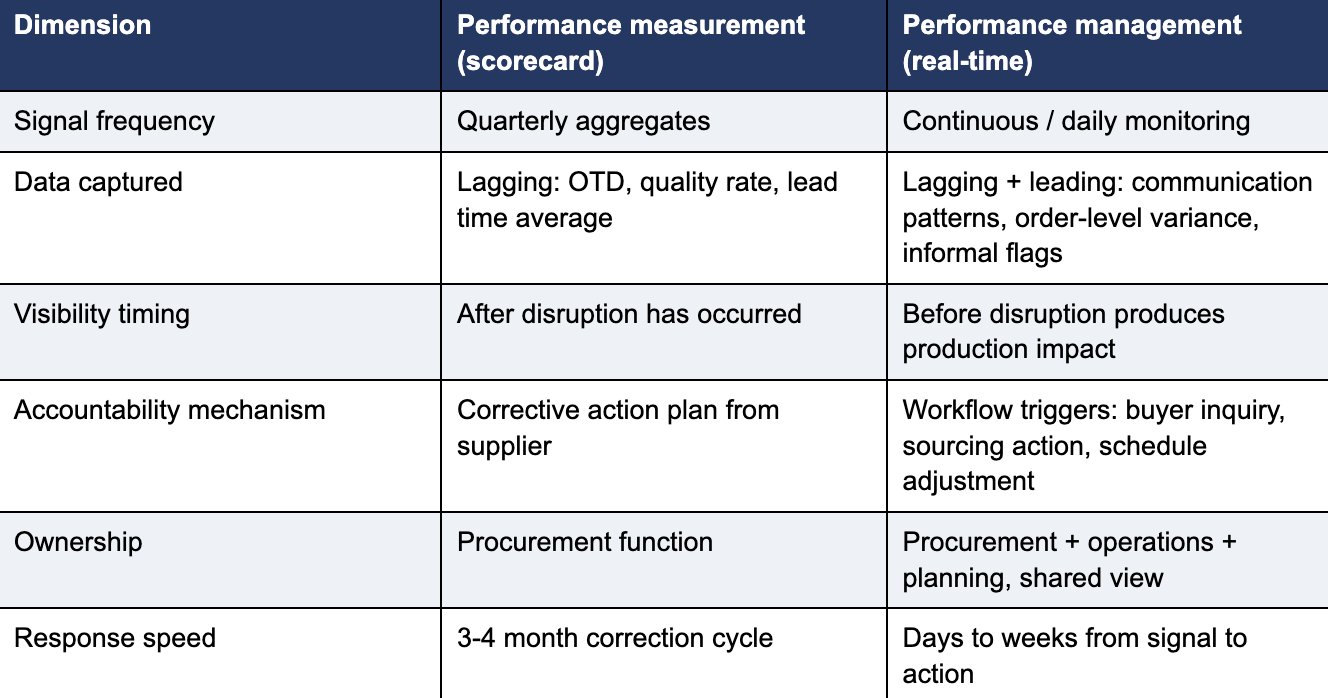
What Real-Time Coordination Actually Requires
The shift from retrospective scorecards to real-time supplier coordination is a workflow design problem more than a technology problem. The data required for continuous supplier monitoring exists in most manufacturing operations - in the ERP, in the procurement system, in the quality management records, in the email and communication logs. The gap is not data availability; it is the absence of a structured workflow that aggregates these signals, evaluates them against defined thresholds, and routes the output to the people who can act on it in time to make a difference.
Three design elements distinguish a real-time supplier coordination model from a scorecard-plus-review model.
The first is supplier criticality tiering. Not all suppliers require the same monitoring intensity. Tier 1 suppliers - those whose failure would disrupt production within days - require daily or near-real-time signal tracking, automated alerting on any deviation from baseline behavior, and direct integration between their order status and the buyer's production planning system. Tier 2 suppliers receive structured monitoring on a weekly cadence. Tier 3 suppliers receive standard quarterly review. The tiering decision is based on supply risk and production criticality rather than spend level, which means a small supplier of a sole-sourced critical component may be Tier 1 regardless of its contribution to total procurement spend.
The second is a supplier portal or structured information exchange that moves communication out of email and into a format that feeds production planning directly. When a supplier updates an order's delivery date in an email, that update requires a purchasing agent to read the email, interpret the change, and manually update the ERP. When the same supplier updates the order status in a structured portal, the update flows directly into the buyer's production planning system, triggers an automated alert if the new date creates a schedule risk, and initiates the escalation workflow defined for that supplier tier and part criticality. The information content is the same; the operational response speed is materially different.
The third is a defined escalation workflow for each signal category. When a Tier 1 supplier's PO acknowledgement has not arrived within 24 hours, the escalation workflow routes an automated inquiry to the supplier and notifies the responsible buyer. When the supplier's delivery confirmation for a critical part shows a date that is outside the acceptable planning window, the workflow escalates to the planning manager and initiates the alternate sourcing protocol. These escalation paths are defined before the signal arrives, not improvised after it. The workflow removes the dependency on an individual buyer's judgment about whether a signal is serious enough to escalate and how - which is the dependency that allows early warning signals to go unacted upon.
How Haptiq Supports Supplier Performance Management
Haptiq's Orion platform provides the operational data layer that makes continuous supplier monitoring operationally real rather than aspirationally described. Orion consolidates the supplier performance signals that currently exist in disconnected systems - PO status and lead time data from the ERP, quality flags from inspection records, communication pattern data from procurement workflows, and capacity utilization information from structured supplier exchanges - into a unified view that production planning and procurement share in real time. The consolidation is what makes supplier performance management possible: when the signals arrive in one place, on a continuous basis, the workflow logic that converts signals into actions can be applied systematically rather than case by case.
For PE-backed manufacturing portfolio companies, Olympus Performance Management gives operating partners the portfolio-level view to identify where supplier concentration risk is highest across the portfolio, which portfolio companies have the most mature supplier monitoring capabilities, and where a supply disruption at a shared supplier could simultaneously affect multiple portfolio companies. This portfolio visibility converts supplier performance from a per-company operational metric into a fund-level risk management input - which is the vantage point that operating partners need to allocate operational improvement attention efficiently across a portfolio with multiple manufacturing companies in concurrent value creation cycles.
For further reading on the downstream operational cost that supplier performance failures produce when they are not caught upstream, the Haptiq blog article Why Procurement Exceptions Are the Largest Hidden Cost in Manufacturing examines how the exception work generated by supply disruptions - expediting, substitution, schedule replanning - accumulates into a capacity drain that is invisible in standard manufacturing cost reporting. Supplier performance failures that reach the production floor are the primary source of the procurement exceptions that article describes, which is why investing in the upstream monitoring and coordination capability is the most leveraged intervention in reducing manufacturing exception work.
From Measurement to Management
Supplier performance management is one of the most mature disciplines in manufacturing operations, with a well-established vocabulary of metrics, scorecards, and review structures. The maturity of the measurement infrastructure makes it easy to mistake measurement for management. Quarterly reviews are disciplined. Scorecards are sophisticated. Corrective action processes are structured. And supply disruptions continue, because the events that produce them are moving at a speed the measurement infrastructure was not designed to track.
The shift from measurement to management requires a different design premise: that supplier performance signals are operational inputs to production planning, not retrospective records for procurement review. Acting on that premise means monitoring continuously rather than quarterly, tracking leading indicators alongside lagging ones, and connecting the signals to the workflow triggers that enable action before the disruption reaches the floor. It means tiering suppliers by production criticality rather than spend, building the structured information exchange that moves supplier communication out of email, and defining the escalation paths that route emerging supply problems to the right decision-maker within hours rather than surfacing them in a review meeting weeks later.
Operations that make this shift find that the investment in upstream monitoring consistently produces a lower total cost than the expedition, overtime, and customer delivery impact that downstream disruptions accumulate. The signal arrives earlier. The response is faster. The disruption either does not reach the production floor or is absorbed with a fraction of the operational cost it would otherwise require. Contact Haptiq to scope what a real-time supplier coordination model would look like for your specific supply base, production environment, and supplier performance management maturity.
Frequently Asked Questions
1. Why do quarterly supplier scorecards fail to prevent supply disruptions?
Because supply disruptions develop in real time and quarterly reviews surface them retrospectively. By the time a supplier's on-time delivery rate has declined enough to register on a scorecard, the production impact has already been absorbed. The scorecard identifies the problem accurately but too late for the identification to be useful. Prevention requires signals that are visible before the disruption occurs - communication pattern shifts, lead time variance at the individual order level, and informal quality flags that individually appear minor but together indicate a supplier under strain.
2. What metrics should supplier performance management actually track?
Both lagging and leading indicators. Lagging indicators - on-time delivery rate, quality rejection rate, fill rate, lead time variance - are the standard scorecard metrics. They are necessary but not sufficient. Leading indicators - PO acknowledgement timing, delivery confirmation response time, communication frequency before shipment, and the ratio of proactive to reactive supplier communication - surface supplier strain before it produces a scorecard-visible failure. The combination of both categories, monitored continuously rather than quarterly, is what distinguishes a performance management system from a performance measurement system.
3. What is the difference between supplier performance measurement and supplier performance management?
Measurement produces data about how a supplier has performed. Management converts that data into actions that change how the supplier will perform. Most operations have supplier performance measurement: scorecards, periodic reviews, KPI dashboards. Fewer have operational management in the true sense: automated alerts when performance signals shift, structured escalation paths that surface problems before production is affected, and workflow triggers that initiate corrective actions without requiring a human to manually interpret a dashboard and decide what to do. The gap between measurement and management is where most supply disruptions originate.
4. How many suppliers should be actively monitored in real time?
All strategic suppliers - those whose failure would disrupt production within days rather than weeks. The practical approach is criticality tiering: Tier 1 suppliers (sole-sourced or single-geographic critical components) receive daily or near-real-time signal tracking and automated alerting. Tier 2 suppliers receive structured weekly monitoring. Tier 3 suppliers receive standard periodic review. The tiering decision is based on production criticality rather than spend - a relatively small supplier of a sole-sourced critical component is Tier 1 regardless of its contribution to total procurement spend.
5. What does real-time supplier coordination actually look like in practice?
It looks like a structured information exchange where critical suppliers update order status and exception flags in a format that feeds directly into the buyer's production planning system - not email attachments that a purchasing agent has to manually read and interpret. It looks like automated alerts when a signal crosses a defined threshold, routing the alert to the right decision-maker with a defined escalation path rather than requiring someone to notice the signal on a dashboard. And it looks like workflow triggers that initiate alternate sourcing protocols, schedule adjustments, or buyer inquiries within hours of the signal, rather than surfacing the issue in a review meeting after the disruption has already reached the production floor.


.png)


.png)
.png)


.svg)


.png)


.png)


.png)
.png)


.png)


.png)
.png)
.png)


.png)


.png)


.png)


.png)