Observability: The Secret to Building Reliable Software Systems
Observability tools like Elastic, Datadog, and Prometheus reveal software system secrets, enhancing reliability with real-time insights. Learn how they cut downtime, optimize resources, and why Haptiq’s solutions make your systems unbreakable.


Software failures don't announce themselves. A memory leak quietly degrades performance. A misconfigured service silently drops requests. A database bottleneck builds pressure until something breaks — usually at the worst possible moment.
If your team is spending more time reacting to incidents than preventing them, the problem isn't effort. It's visibility. And that's exactly what observability in software systems is designed to solve.
In this article, we'll break down what observability actually means, how it differs from traditional monitoring, which tools lead the space, and how businesses can implement it in a way that drives real operational outcomes — not just more dashboards.

What is observability in software systems?
Observability is the ability to understand what's happening inside a software system by examining its outputs. Rather than waiting for a predefined alert to fire, observability lets your team ask arbitrary questions about system behavior — and get answers in real time.
The three foundational data types that make this possible are:
- Logs — timestamped records of discrete events (errors, state changes, user actions)
- Metrics — numerical measurements collected over time (CPU usage, request latency, error rates)
- Traces — end-to-end records of how a request flows through distributed services
Together, these three pillars give engineering teams a complete picture of system health — not just a snapshot of what's broken, but the context needed to understand why it broke and how to fix it.
Monitoring vs. observability: what's the difference?
This is one of the most common questions teams ask, and it's worth being precise about.
Monitoring tells you what is wrong. It watches predefined metrics and fires alerts when thresholds are crossed. It's reactive by design — you know something is broken because a dashboard turned red.
Observability tells you why something is wrong. It gives you the instrumentation and querying capability to investigate unknown failure modes — the kind of issues that don't fit neatly into a predefined alert. Instead of asking "did this metric cross a threshold?", observability lets you ask "what was happening across my entire system at the moment this request failed?"
The practical difference: monitoring catches known problems. Observability helps you discover and diagnose problems you didn't know to look for.
Modern observability implementations often rely on OpenTelemetry, an open-source instrumentation framework that standardizes how logs, metrics, and traces are collected and exported across services — making it easier to build a consistent observability layer regardless of which backend tools you use.
At Haptiq, we apply these same principles across our Pantheon AI & Data, using AI-driven analysis to surface system signals that matter — so teams spend less time hunting for root causes and more time building.
How observability tools improve reliability
The observability tooling landscape has matured significantly. Three platforms stand out for their depth, ecosystem support, and real-world adoption: Elastic, Datadog, and Prometheus. Here's how each one contributes to software reliability.
Elastic clarifies system complexity
Elastic aggregates logs, metrics, and performance data into a unified view, giving teams a single place to investigate system behavior across applications and infrastructure. Its real-time search and analytics capabilities make it particularly effective for root cause analysis — when a service slows down, Elastic can help you pinpoint whether the culprit is a failed API call, a memory leak, or a downstream dependency, often before users notice anything is wrong.
Elastic's machine learning features add another layer of value, automatically detecting anomalies in log patterns and metric trends. For businesses running complex, distributed architectures, this means fewer manual investigations and faster time-to-resolution. Customizable dashboards let teams surface the signals that matter most to their specific systems and workflows.
Datadog provides full-system visibility
Datadog operates as a unified observability platform across applications, infrastructure, and user experience. Its strength lies in breadth: it tracks everything from server latency and error rates to container health and third-party service dependencies, all within an intuitive interface that doesn't require deep configuration expertise to get value from.
AI-powered anomaly detection flags irregularities before they escalate — whether that's an unexpected traffic spike, a database connection pool nearing exhaustion, or a deployment that quietly introduced a regression. Datadog's integrations with AWS, Kubernetes, and hundreds of other services make it a natural fit for cloud-native environments, and its alerting system is flexible enough to route the right signals to the right teams without creating noise fatigue.
Prometheus delivers metrics insight for robust systems
Prometheus is the open-source standard for metrics-driven observability, particularly in Kubernetes and cloud-native environments. It collects and stores time-series data — latency, CPU usage, error rates, saturation — and makes it queryable through PromQL, a powerful expression language that lets teams ask precise questions about system behavior over time.
Where Prometheus really shines is in its ecosystem. Paired with Grafana for visualization and Alertmanager for routing, it provides a complete metrics observability stack that scales well and integrates cleanly with modern infrastructure. For teams that want control over their observability stack without vendor lock-in, Prometheus is often the foundation they build on.
Benefits of observability for businesses
Observability in software systems isn't just a technical capability — it's a business advantage. Here's what it delivers in practice:
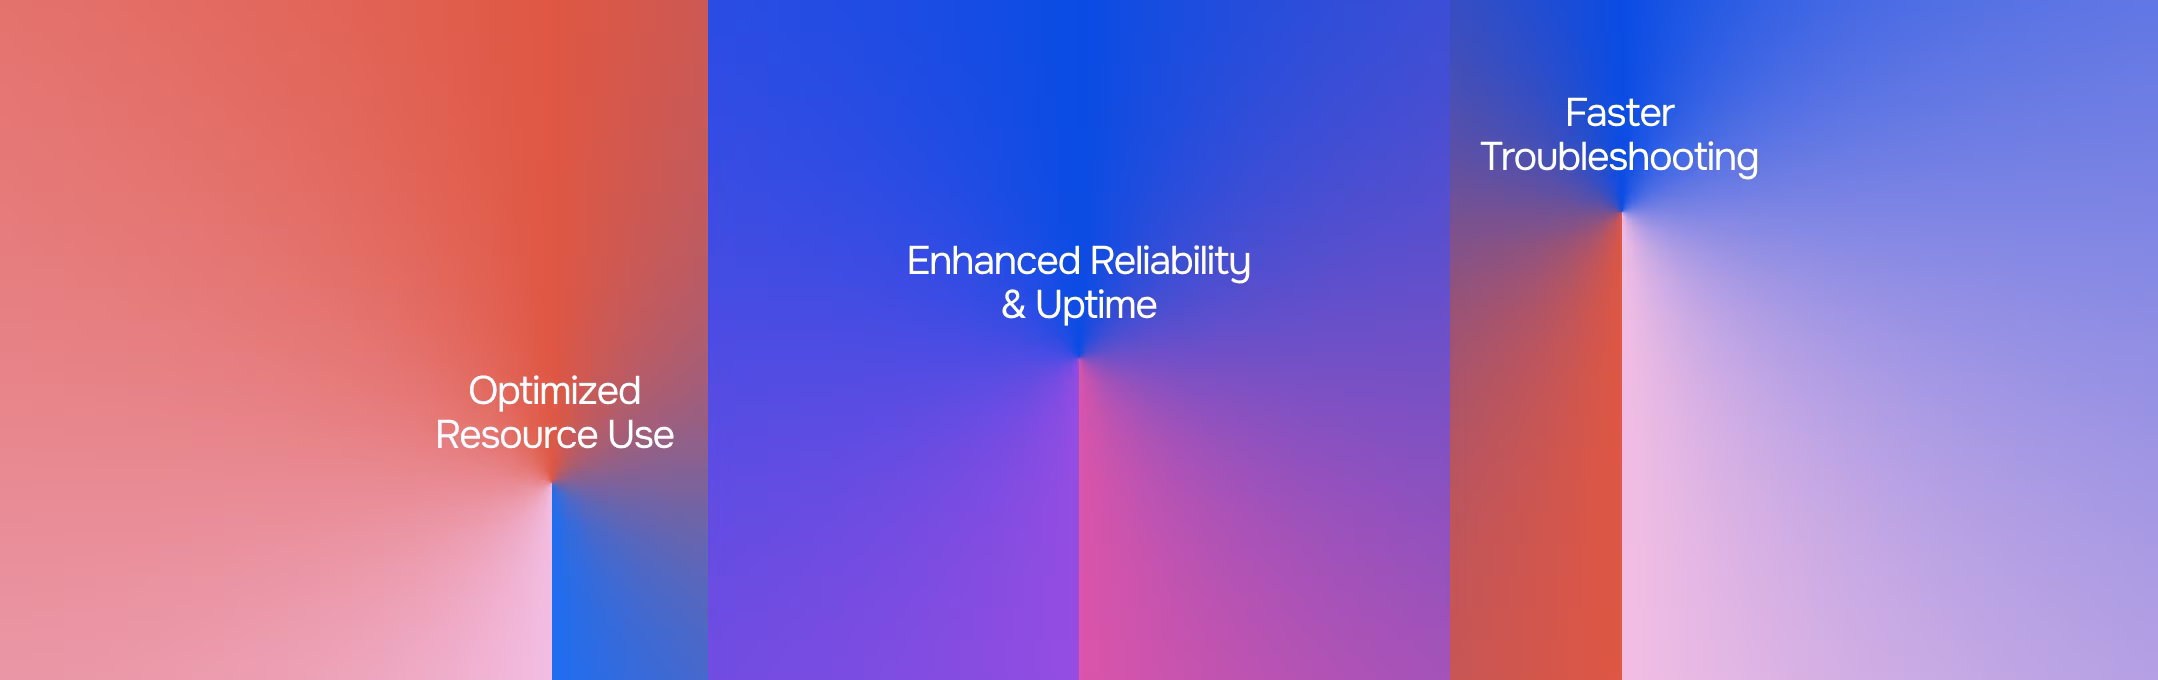
- Improved reliability and uptime — catch issues before they reach users
- Optimized resource efficiency — eliminate waste from over-provisioned or underutilized infrastructure
- Faster troubleshooting — reduce mean time to resolution (MTTR) with granular, correlated data
- Scalable growth — maintain visibility as systems and teams expand
Let's look at each of these in more depth.
Enhanced reliability and uptime
Distributed systems fail in ways that are difficult to predict. A single failing microservice can cascade into a broader outage. A bottlenecked queue can degrade user experience across an entire application. Observability tools catch these problems early — often before they become visible to end users — by continuously monitoring the signals that indicate system stress.
The rise of open-source observability solutions like Elastic's ELK Stack, combined with the complexity of serverless and microservices architectures, has made this kind of proactive visibility a standard expectation for DevOps and platform engineering teams. Organizations that invest in observability consistently report fewer major incidents and faster recovery when issues do occur.
Optimized resource use
Without visibility into how resources are actually being consumed, infrastructure decisions are guesswork. Teams over-provision to avoid risk, or under-provision and pay for it in performance degradation. Elastic, Datadog, and Prometheus all surface usage patterns that make right-sizing straightforward — showing exactly where compute, memory, and network resources are being consumed, and where they're being wasted.
For businesses, this translates directly to cost savings and a more efficient engineering operation. Budget that was going toward over-provisioned servers can be redirected toward product development and growth initiatives.
Faster troubleshooting
When something goes wrong, every minute of downtime has a cost — in revenue, in user trust, and in engineering time. Observability dramatically reduces mean time to resolution by giving teams correlated data across logs, metrics, and traces. Instead of manually correlating events across disconnected systems, engineers can follow a trace from a user-facing error back through every service it touched, identifying the exact point of failure.
This speed matters operationally. It also matters culturally — teams that can resolve incidents quickly are less likely to be consumed by firefighting and more able to focus on building.
Scalable growth
As businesses grow, their systems grow with them. New services, new integrations, new traffic patterns — all of these introduce new failure modes. Observability scales alongside your architecture, ensuring that visibility doesn't degrade as complexity increases.
Prometheus's pull-based architecture scales well across large Kubernetes clusters. Datadog's integrations cover hundreds of services and cloud providers. Elastic handles log volumes that would overwhelm simpler solutions. And Haptiq's Pantheon System Integration services are designed with this same adaptability in mind — ensuring that as your systems evolve, your operational visibility keeps pace.
Challenges of implementing observability
Observability delivers significant value, but it's not without implementation complexity. Here are the three most common challenges teams encounter:
- Complexity and learning curve — tooling setup, instrumentation, and query languages require investment
- Data overload — more data isn't always better without the right filtering and focus
- Cost management — observability at scale can be expensive if not architected thoughtfully
Complexity and learning curve
Prometheus requires expertise to configure correctly — setting up exporters, writing PromQL queries, and managing retention policies all take time to learn. Elastic and Datadog are more accessible out of the box, but integrating them into complex environments still demands careful planning. Teams that underinvest in training often end up with observability tooling that's technically deployed but practically underused.
The solution isn't to avoid complexity — it's to build toward it incrementally. Start with the signals that matter most to your business (error rates, latency, availability), instrument those well, and expand from there.
Data overload
Observability generates a lot of data. Logs from every service, metrics from every endpoint, traces from every request — without a clear strategy for what to collect and how to prioritize it, teams can end up drowning in noise rather than surfacing signal.
Smart filtering, sampling strategies, and well-designed dashboards are essential. The goal isn't to collect everything — it's to collect the right things and make them queryable when you need them. Elastic's filtering capabilities and Datadog's AI-powered anomaly detection both help teams cut through the noise.
Cost considerations
Datadog's pricing scales with the volume of data ingested and the number of hosts monitored, which can add up quickly in large environments. Elastic's enterprise features carry their own cost. Even Prometheus, while open-source, requires infrastructure investment to run reliably at scale.
The key is to treat observability as an investment with a measurable return — reduced downtime, faster incident resolution, lower infrastructure waste — and to architect your observability stack in a way that controls costs without sacrificing the visibility that matters most.
How to start adding observability to your applications
Getting started with observability doesn't require a complete platform overhaul. A practical approach looks like this:
- Instrument your services — use OpenTelemetry to add standardized logging, metrics, and tracing to your applications. This gives you a consistent data foundation regardless of which backend tools you choose.
- Connect to an observability platform — route your telemetry data to Elastic, Datadog, Prometheus, or a combination, depending on your team's needs and existing infrastructure.
- Define what matters — identify the key signals for your business: which services are most critical, what latency thresholds are acceptable, which error rates indicate a real problem versus normal noise.
- Set up alerts and dashboards — build dashboards that surface your most important signals at a glance, and configure alerts that route to the right people without creating alert fatigue.
- Iterate — observability is not a one-time implementation. As your systems evolve, your observability coverage should evolve with them.
If you're working with complex, multi-system environments — or if you're a portfolio company navigating rapid growth or post-merger integration — Haptiq's team can help you design and implement an observability strategy that fits your architecture and your operational goals.
Conclusion — improving reliability with Haptiq
Observability in software systems is one of the highest-leverage investments an engineering organization can make. It transforms reactive incident response into proactive system management, reduces the cost of downtime, and gives teams the confidence to move fast without breaking things.
Elastic, Datadog, and Prometheus each bring distinct strengths to this challenge. The right combination depends on your architecture, your team's expertise, and the specific reliability outcomes you're optimizing for.
At Haptiq, we help businesses design and implement observability strategies that go beyond tooling — connecting system visibility to operational outcomes and business performance. Pantheon applies AI-driven analysis to system telemetry, helping teams surface the signals that matter and act on them faster. And our Pantheon System Integration services ensure that observability fits cleanly into your broader technology architecture.
Ready to build systems you can trust? Book a demo with Haptiq and let's talk about what reliable looks like for your business.
Frequently asked questions
1) What is observability in software systems?
Observability is seeing what's happening inside your software by watching its outputs — logs, metrics, and traces. It goes beyond basic monitoring: instead of only telling you something is wrong, it helps you discover why and fix it fast. A well-instrumented system lets your team ask arbitrary questions about behavior, not just check predefined alerts.
2) How do observability tools like Elastic, Datadog, and Prometheus improve reliability?
Each tool streams telemetry data — logs, metrics, and traces — from your applications and infrastructure, making it possible to spot anomalies, trace failures to their root cause, and fix issues before they impact users. Elastic excels at log aggregation and search. Datadog provides broad, AI-assisted visibility across cloud environments. Prometheus delivers precise, scalable metrics collection for cloud-native systems. Used together or individually, they give teams the data they need to maintain reliable, high-performing software.
3) What's the difference between monitoring and observability?
Monitoring tells you what is wrong — it watches predefined metrics and fires alerts when thresholds are crossed. Observability tells you why something is wrong — it gives you the instrumentation and querying capability to investigate unknown failure modes. Monitoring is reactive; observability is exploratory. Both matter, but observability is what enables teams to diagnose complex, distributed failures that don't fit neatly into a predefined alert.
4) What are the three pillars of observability?
The three pillars of observability are:
- Logs — timestamped records of discrete events within a system
- Metrics — numerical measurements collected over time (latency, error rates, resource usage)
- Traces — end-to-end records of how individual requests flow through distributed services
Together, these three data types give teams a complete picture of system behavior and the context needed to diagnose issues quickly.
5) How can I start adding observability to my applications?
A practical starting point: instrument your services using OpenTelemetry to standardize how telemetry data is collected. Connect that data to an observability platform (Elastic, Datadog, or Prometheus). Define the signals that matter most to your business — critical services, acceptable latency thresholds, meaningful error rates. Build dashboards and alerts around those signals. Then iterate as your systems and understanding evolve. If you're working with complex environments or need help designing an observability strategy, Haptiq's team can help you get there faster.
6) Why choose Haptiq for observability and system reliability?
Haptiq combines observability expertise with AI-driven data analysis and deep system integration experience. Rather than deploying tools in isolation, we help businesses build observability strategies that connect system visibility to operational outcomes — reducing downtime, accelerating incident resolution, and scaling reliably as your architecture grows. Our Pantheon platform applies AI to system telemetry, surfacing the signals that matter and enabling faster, more confident decision-making.


.png)


.png)


.png)
.png)


.png)


.png)


.png)
.png)


.svg)
.png)

.png)
.png)
.png)


.png)


.png)


.png)


.png)